
Reading the tentpole: how to build momentum for your Amazon ads after Black Friday
We made it through ‘Amazon Turkey 5’ season 2023, and with pretty great results!
As we celebrate higher sales volume and targets being reached around Black Friday and Cyber Monday, we’re at a crucial point to ensure we keep momentum going and double down on our success.
![]()
Image by Freepik
It’s well known that just before and after these key dates, Conversion Rate or Purchase Intent are lower, as shoppers are either waiting for deals to go live, or they’ve just been through their end-of-year Amazon shopping spree.
So we usually see a decrease in advertising efficiency, and are pushed to decrease spend while waiting for the big day.
But what if we had proof that the lead-up and lead-out phases for these events are just as important as the events themselves?
This is what Amazon Marketing Cloud (AMC) helps us deliver for many of our clients, with its Amazon Tentpole Phase Analysis report.
What is the Amazon Tentpole Phase Analysis report?
This report helps you analyse the main KPIs across the three main phases of any event - Lead-up, Main Event and Lead-out. You can analyse them one at a time, two at a time or the three combined.
To give you a tangible example, for one of our clients, our main KPI to track was the Purchase Rate during the Fall Prime Day: in other words, the percentage of shoppers who saw our ad and made a purchase.
We decided to measure this across any possible combination of phases to apply learnings to BFCM, and the scenario we found was the following:
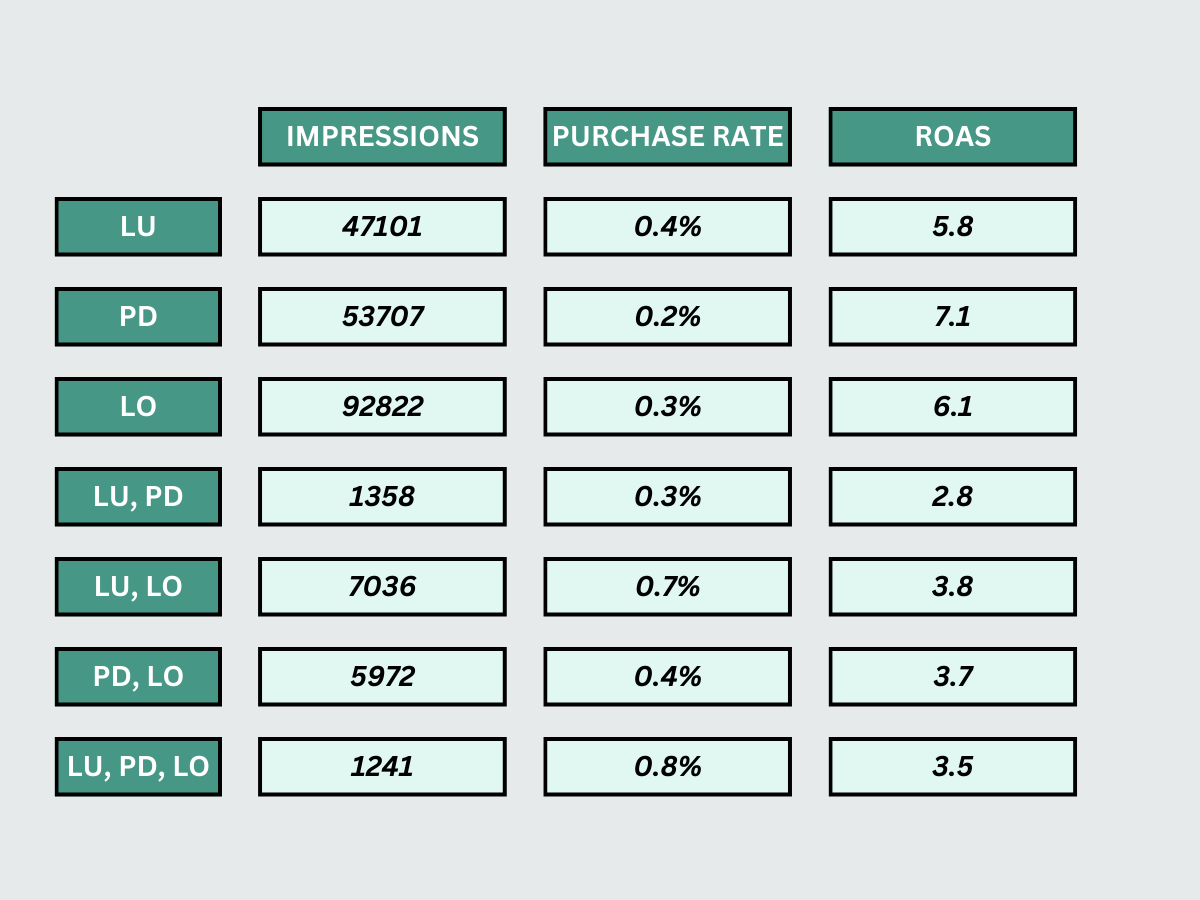
The table shows the daily distribution of Impressions, Purchase Rate and ROAS across the three different phases: LU = Lead-up, PD = Prime Day, LO = Lead-out.
As you can see, by looking at the Impressions column, most of the traffic came through the Lead-out phase, while the higher ROAS was recorded during Prime Day.
However, the higher Purchase Rate belongs to the combination of the three phases. This means that shoppers who saw our ads throughout the three phases were more likely to convert.
Two major learnings
The table above highlights two major points:
1: The lack of traffic distribution across the three phases. Purchase Rate is higher when the three phases are combined, but this combo did not occur often enough.
2: The great traction and great ROAS during the Lead-out phase. While we always talk about “ramping up” for major events, this report shows that we can capitalise on the Lead-out phase just as much.
Based on the Fall Prime Day learnings above, we took two actions for Black Friday and Cyber Monday:
- We created a budget distribution plan that evenly covered the three phases from the seven days prior to the event to the seven days following the event, ensuring that the traffic generated during Black Friday could match the daily occurrences of Lead-up and Lead-out. This was to replicate the higher Purchase Rate conditions
- We devised a plan to ensure coverage of the Lead-out phase while pulling back on spend for low performance/low margin ASINs.
And the results…
As a result, we achieved a 44% increase in daily sales within seven days from implementing the strategy. We also reduced TACOS by 15% by the end of the seven days after Cyber Monday by focusing on successful and high-margin ASINs.
With this report, we have laid the groundwork for next year’s tentpole events: it will allow us to distribute the budget accurately across the three phases.
The next layer is to carry out this analysis based on ad types, and be as granular as possible, to ensure every penny is spent as profitably as possible.